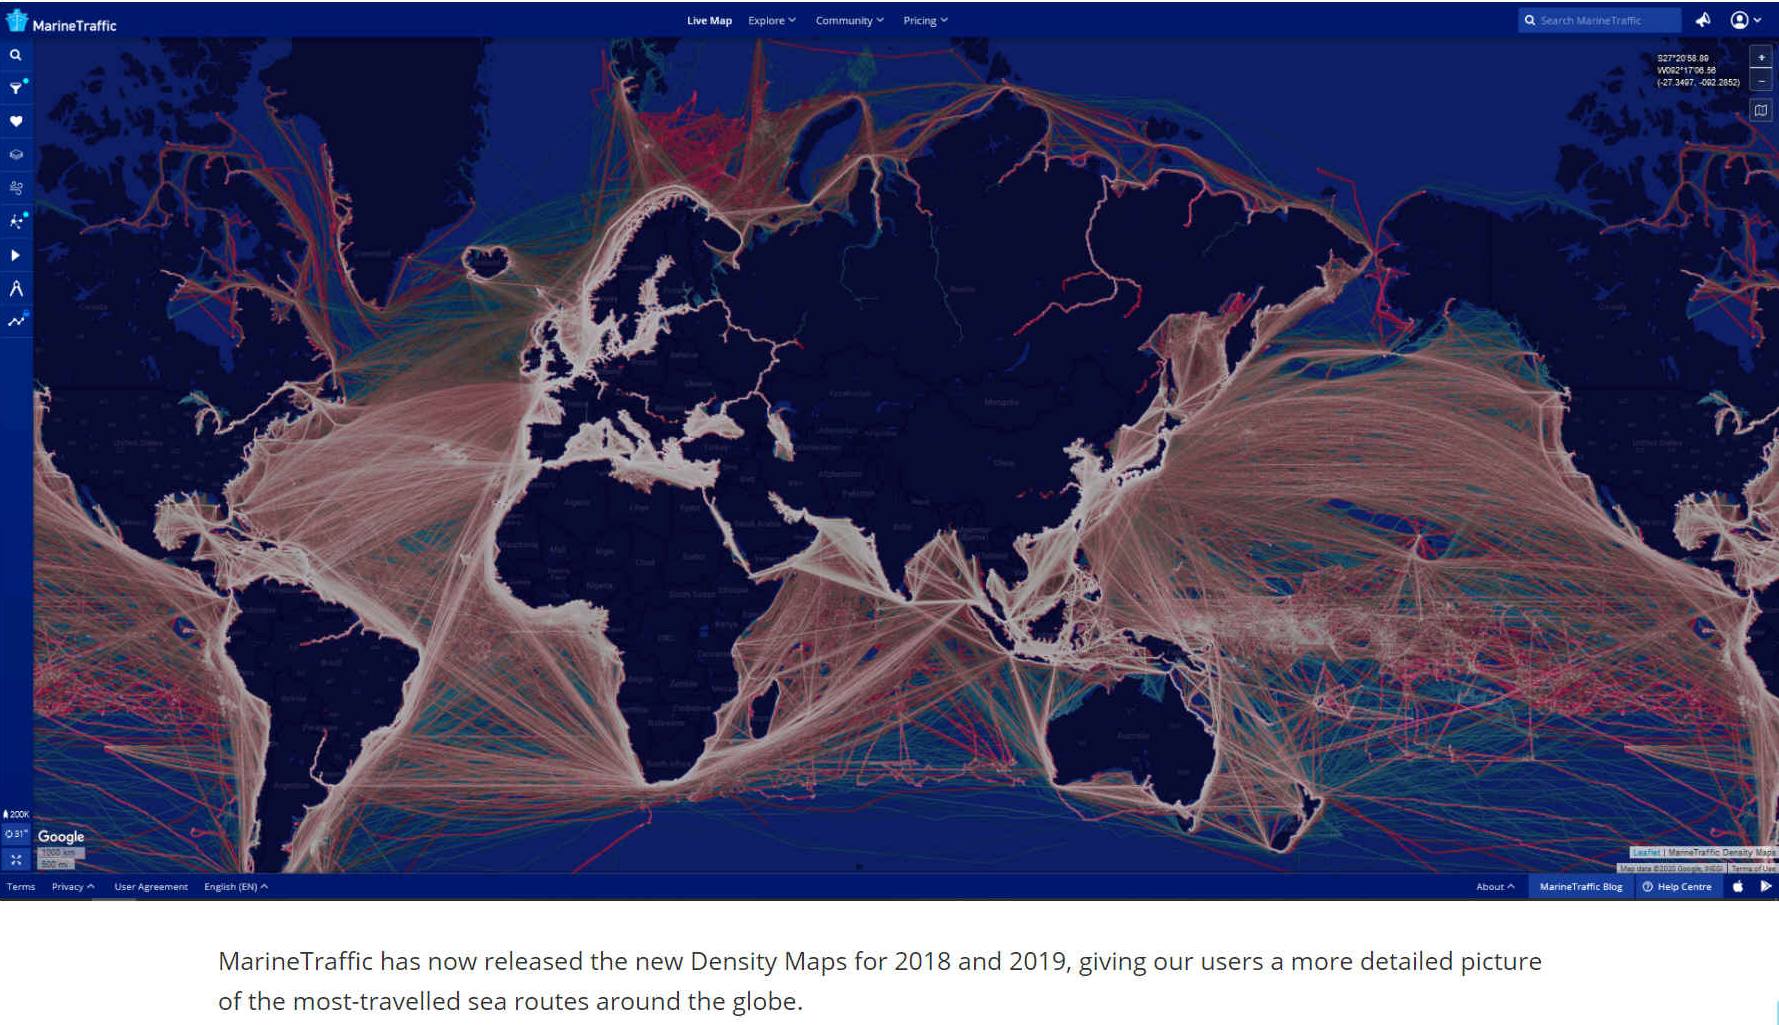
GIS
- Is a rapidly expanding science that when used with data analytics (including
cloud computing) can be a powerful development tool - as seen in the
density map above from Marine
Traffic.
As an emerging technology the field of geographic information systems (GIS) is constantly evolving. Over a span of twenty years, members of the geographic information community have seen this technology advance from command line, workstation-based software to tools that can now be used in the cloud and via mobile
devices, such as providing local weather information.
The terms GIS (which most commonly is an acronym for Geographic Information Systems) and geospatial are often used interchangeably. There are differences in what the terms GIS and geospatial mean.
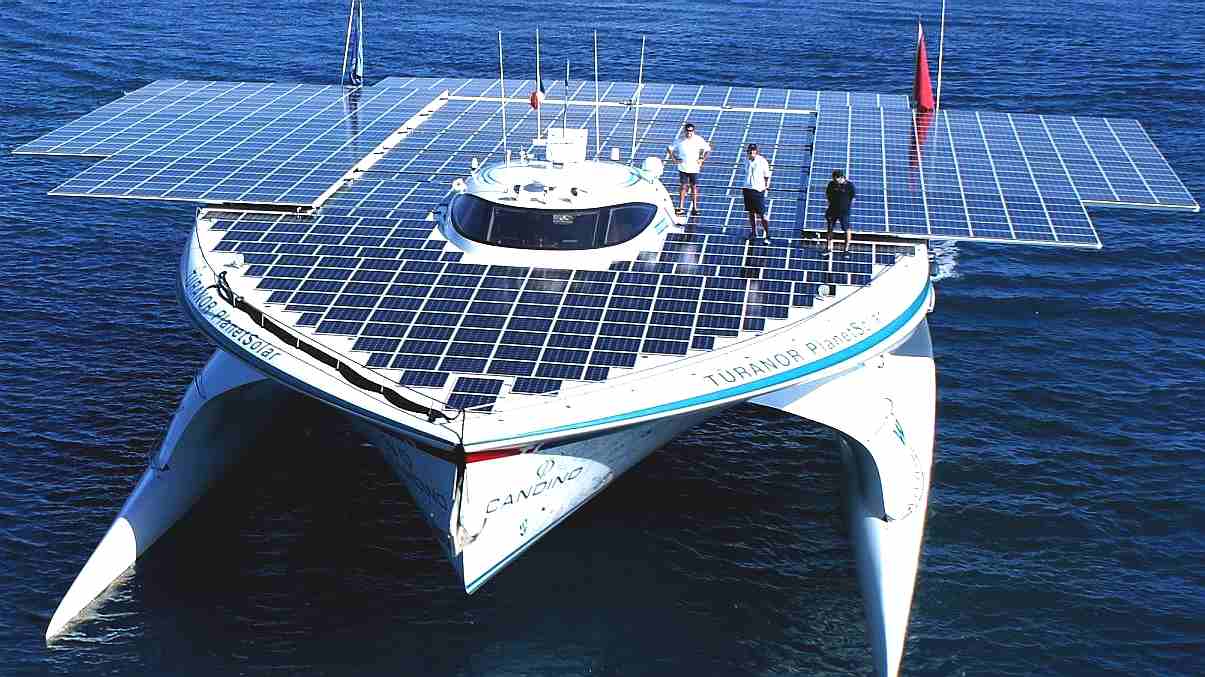
ATLANTIC
CHALLENGE
- For the Elizabeth
Swann, the Cleaner
Ocean Foundation would like to utilise the power of geospatial data
harvesting, linked to cloud computing analysis and data dissemination -
as a development tool for clean shipping. Specifically in relation to
solar and wind powered (electric) vessels that harvest the energy they
need for propulsion from nature.
The
proposed attempt to improve on the existing solar record (5.3) knots, is
an ideal proving ground for computing power, to reveal the best
navigation course for speed, and then reliability. We hope to use such
techniques via Artificial Intelligence, both on an off-board, to trim a
zero emission vessel for maximum performance. In the process,
identifying the best Green routes for commercial shipping.
WHAT IS GIS?
GIS refers to a system where geographic information is stored in layers and integrated with geographic software programs so that spatial information can be created, stored, manipulated, analyzed, and visualized (mapped).
The key word to this technology is Geography – this means that some portion of the data is spatial. This means that the data is in some way referenced to locations on the earth. Coupled with this data is usually tabular data known as attribute data. Attribute data can be generally defined as additional information about each of the spatial features.
GIS refers more narrowly to the traditional definition of using layers of geographic data to produce spatial analysis and derivative maps. Geospatial is more broadly use to refer to all technologies and applications of geographic data.
Documentation of GIS datasets is known as metadata. Metadata contains such information as the coordinate system, when the data was created, when it was last updated, who created it and how to contact them and definitions for any of the code attribute data.
WHAT IS GEOSPATIAL?
Data about location, or ‘geospatial’ data, is the record of what we do, and where we do it. It underpins a modern digital society.
The term geospatial is a term that has only recently been gaining in popularity and is used to define the collective data and associated technology has a geographic or locational component. A search using Google’s Ngram Viewer shows that the term only entered literature during the late 1980s and has rapidly been rising in frequency ever since then.
GEOSPATIAL DATA
The word geospatial is used to indicate that data that has a geographic component to it. This means that the records in a dataset have locational information tied to them such as geographic data in the form of coordinates, address, city, or ZIP code. GIS data is a form of geospatial data. Other geospatial data can originate from
GPS data, satellite imagery, and
geo-tagging.
GEOSPATIAL
TECHNOLOGY
Geospatial technology refers to all of the technology used to acquire, manipulate, and store geographic information. GIS is one form of geospatial technology. GPS, remote sensing, and geofencing are other examples of geospatial technology.
There are many different ways that GIS data can be collected. Head up digitizing (the process of tracing GIS data directly on the screen), LiDAR, drones, GPS, and satellites are some of the ways GIS data is created.
PROGRAMMING
Python is the most common language for scripting, used by both ArcGIS and QGIS. There are other languages and scripting languages you can learn to round out your skills as a GIS developer.
THE COMPONENTS OF GIS
To fully understand GIS you need to look at each component of a system and how they work together. These components are:
- Hardware
- Software
- Data
- People
HARDWARE
Hardware comprises the equipment needed to support the many activities needed for geospatial analysis ranging from data collection to data analysis. For desktop GIS, the central piece of equipment is the workstation, which runs the GIS software and is the attachment point for ancillary equipment. The use of handheld field technology and mobile GIS is also becoming an important data collection tool in GIS. With the advent of web mapping, web servers have also become an important piece of equipment.
SOFTWARE
Different types of software are important. Central to this is the GIS application package. Such software is essential for creating, editing and analyzing spatial and attribute data, therefore these packages contain a myriad of geospatial functions inherent to them. Extensions or add-ons are software that extends the capabilities of the GIS software package. Component GIS software is the opposite of application software. Component GIS seeks to build software applications that meet a specific purpose and thus are limited in their spatial analysis capabilities. Utilities are stand-alone programs that perform a specific function. For example, a file format utility that converts from on type of GIS file to another. There is also web GIS software that helps serve data and interactive maps through Internet browsers.
DATA
Data is the core of any GIS. There are two primary types of data that are used in GIS: vector and raster data. A
geo-database is a database that is in some way referenced to locations on the
earth.
Geodatabases are grouped into two different types: vector and
raster:
-
Vector data is spatial data represented as points, lines and polygons.
-
Raster data is cell-based data such as aerial imagery and digital elevation models.
Coupled with this data is usually data known as attribute data. Attribute data generally defined as additional information about each spatial feature housed in tabular format.

THE GEOSPATIAL COMMISSION
The Geospatial Commission was established in 2018 by the government as an independent, expert committee responsible for setting the UK’s geospatial strategy and coordinating public sector geospatial activity. Our aim is to unlock the significant economic, social and environmental opportunities offered by location data and boost the UK’s global geospatial expertise.
The Geospatial Commission has a mandate and budget to drive and deliver changes by working in partnership with others. This means
they:
* Provide strategic oversight of the geospatial ecosystem in the UK, setting geospatial strategy, policy and standards.
*
Hold the budget for the public sector’s largest investment in geospatial data.
*
Make targeted investments in data projects that accelerate innovation and adoption of geospatial data applications.
THE GEO 6
The
Commission have a formal relationship with six partner bodies
called the Geo6:
1.
British Geological Survey,
2.
Coal Authority,
3.
UK Hydrographic Office,
4.
HM Land Registry,
5.
Ordnance Survey and
6.
Valuation Office Agency.
Each of these partners will play a central role in the delivery of
a strategy that appears designed to maximise revenue (4 & 6) from
rating taxes - via what many will perceive as a modern version of the
Domesday Book. How coal became that important with renewables coming to
the fore is anyone's guess. The National
Grid would perhaps be more appropriate.
We
are more interested in the Hydrographic Office and navigation
internationally for oceanic transport security. More specifically, we'd
like to use geodata to help develop a system for zero carbon shipping.
In 1714 the British government created the Longitude
Prize, which led John Harrison to create the first reliable way to determine location at sea. We set the global standards for navigation and timekeeping at Greenwich. We led the world in mapping: establishing an Ordnance Survey to brace for the Napoleonic wars; charting the world’s oceans; and creating the world’s first geological survey of the rich resources beneath our feet that powered the industrial revolution.
THE INTERNET OF THINGS
A wave of technological change is sweeping through every aspect of our lives, bringing with it a torrent of data. Location-aware devices and connected sensors - the so-called Internet of Things - are now everywhere, giving rise to an abundance of data, in richer and more complex forms than ever before.
The world is starting to see the value in this new resource, including in tackling the threat from the global
Covid-19 pandemic. But it is clear that we are only just beginning to harness its power.
Geospatial, or location data, has the potential to underpin huge advances in our digital society, improving our lives and equipping the economy to recover from the effects of Coronavirus.
From port operators that support our shipping industry to conservationists working to protect critical marine environments, many of those who use our coasts depend on geospatial data to make good decisions.
John Humphrey CEO at the UK Hydrographic Office is quoted as saying:
Marine geospatial data is fundamental to helping us to make better use of the marine environment and ensure its protection for years to come. It’s the foundation on which to develop tourism and trade, as well as support disaster resilience and climate change mitigation.
As a marine geospatial agency, we are experts in sourcing and processing this location-based information, from seabed to surface. By leveraging our data-handling expertise, whether in hydrography and oceanography or software development and data science, we aim to help the Geospatial Commission maximise the value of this data to the UK.
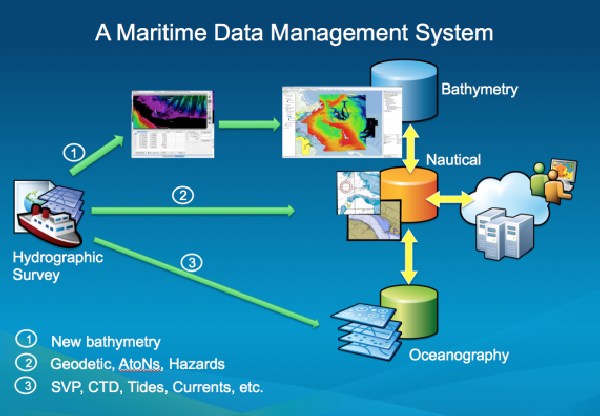
The UK Hydrographic Office (UKHO) holds a broad range of UK marine geospatial data ranging from the seabed to the ocean’s surface. This includes high resolution bathymetry depicting the seafloor, as well as information on the water itself like density, salinity, temperature and movement. Specialist teams also process information on maritime security, marine life, maritime limits and more. This data is vital to helping organisations make better use of the marine environment and use ocean resources in a sustainable way.
CLOUD COMPUTING
There are different types of cloud computing service models: ’Software as a Service’ (SaaS), where the end-user applications are delivered as a service rather than installing software on-premises; ‘Platform as a Service’ (PaaS), where an application platform or middleware is delivered as a service on which developers can build and deploy custom applications; and ‘Infrastructure as a Service’ (IaaS), where computing, storage or other IT infrastructure is delivered as a service rather than as a dedicated capability. ArcGIS Online is a good example of all three.
There are public, private or combined (hybrid) clouds with different benefits from each approach.
BIG DATA
Working with Big Data is challenging because of the volume of the data, the velocity of the data and the variety of the data. The amount of data being collected nowadays is massive. With the grow of social media, multimedia data will continue to grow exponentially in the foreseeable future.
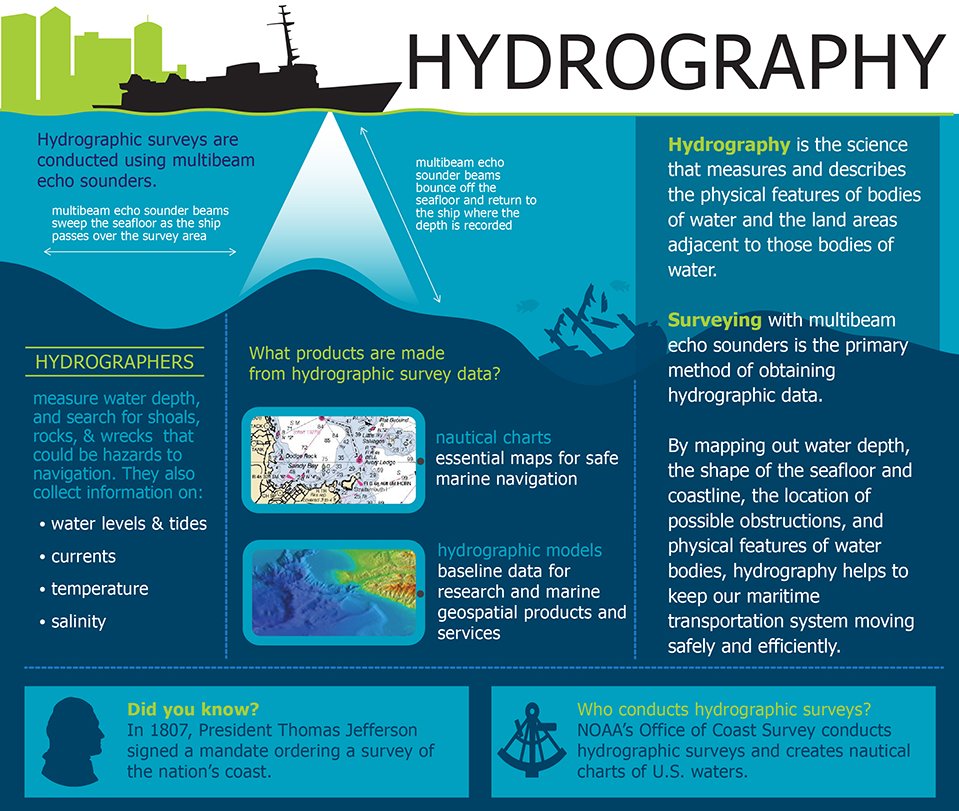
In
Hydrography, with the use of Multibeam Lidar and Satellite systems for bathymetric data collection in combination with new and more powerful data collection and post-processing software, Big (Hydrographic) Data is a reality, and the challenge comes when the user tries to analyse those huge datasets that can jeopardise productivity.
Big Data, when used to its full extent, generates value by way of savings in production and diversifying data use. Users can analyse big data using ArcGIS tools and spatially query billions of records in a matter of minutes instead of hours, simply by taking the software to the data rather than the data to the software, unlocking significant value by making information transparent and usable at a higher rate, connecting and combining hydrographic data with other types of datasets and reaching many more users.
LINKS
& REFERENCE
https://gisgeography.com/what-is-geodata-geospatial-data/
https://www.hydro-international.com/content/article/the-new-role-of-hydrography-in-the-21st-century7
https://oceanservice.noaa.gov/facts/hydrography.html
https://iho.int/en/s-100-universal-hydrographic-data-model
https://www.gislounge.com/tag/free-gis/