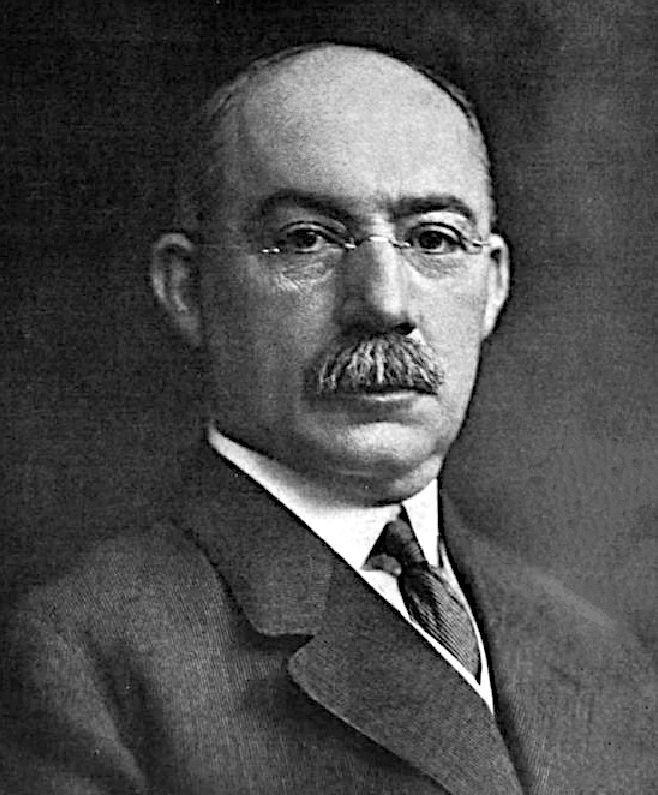
HENRY GANTT


Please use our A-Z INDEX to navigate this site or return HOME


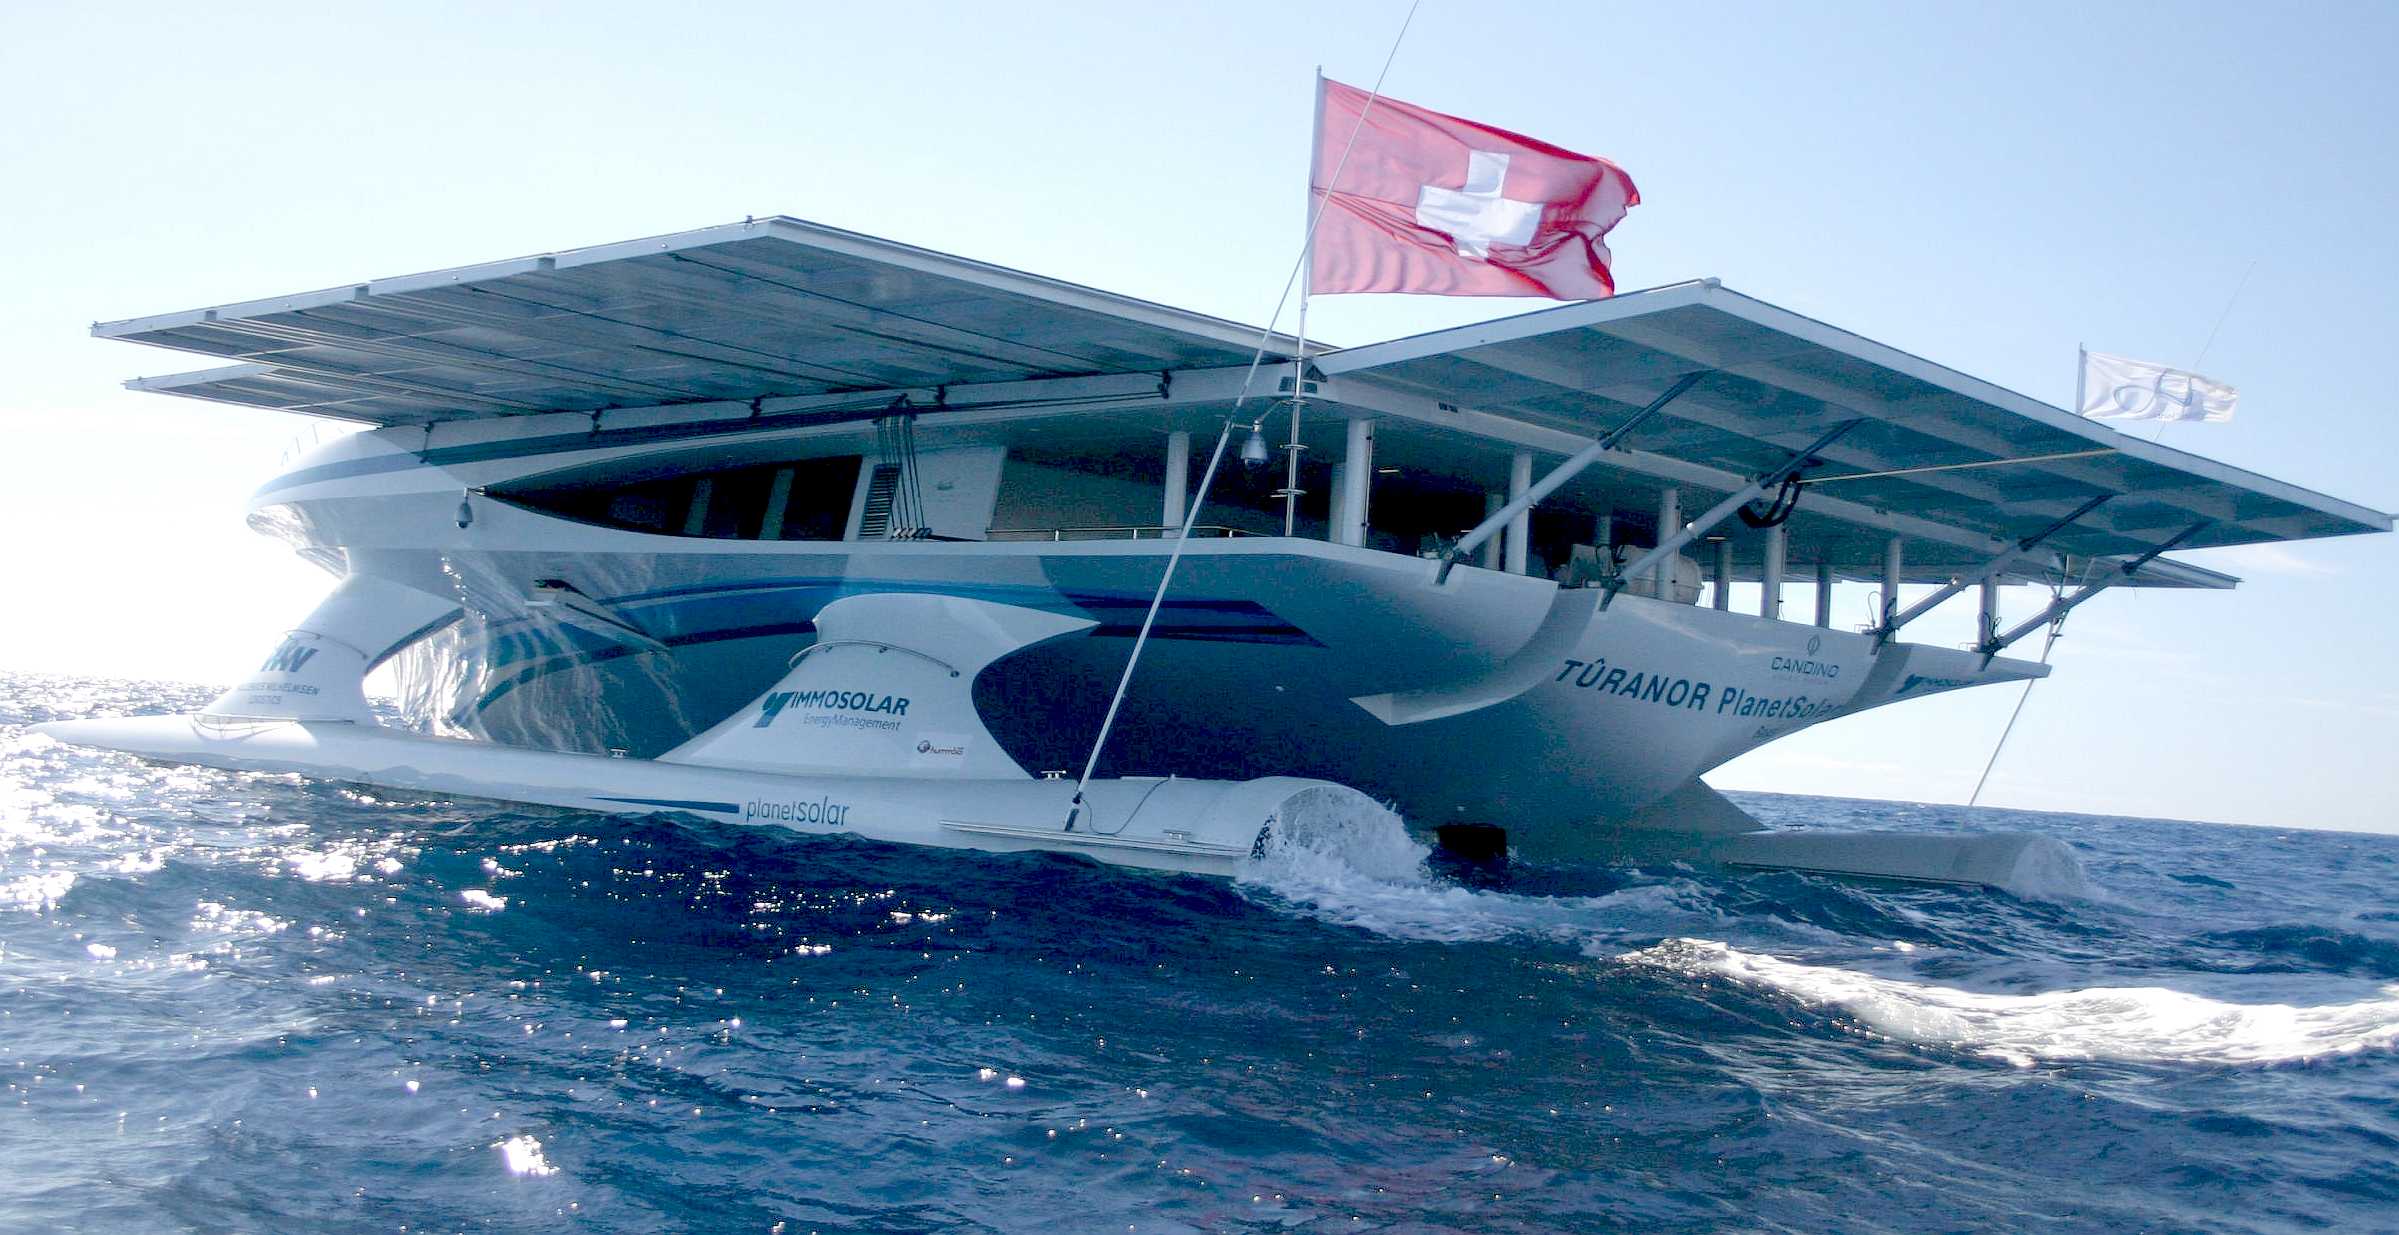
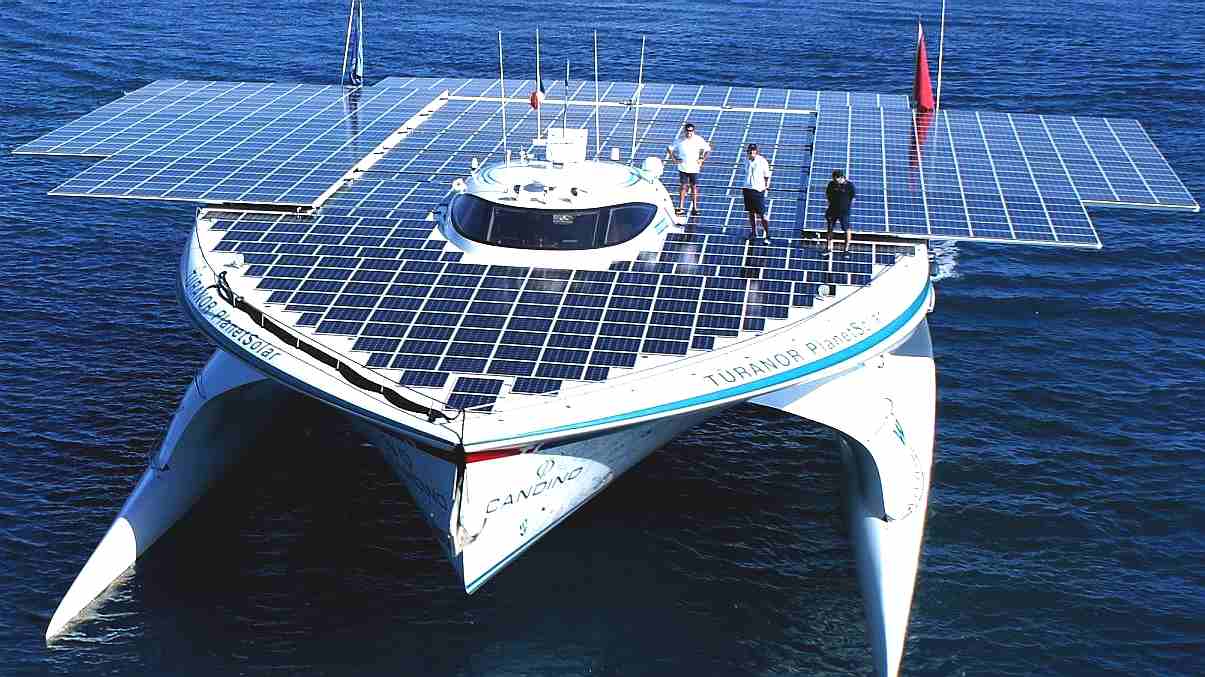
PlanetSolar heading out into uncharted technical waters. The theory was in place, but nobody knew if this solar powered boat could make it. But they did it flying the Swiss flag!


In small projects, making copious charts and graphs might seem like micro management, where the time spent could have been more usefully employed in actually getting the job done. Or, indeed, would be equal to the time needed to complete a project.


But bean counters love them. They've probably never been on a construction site, lifted a hammer or a welding torch. And, heaven forbid they might look at project progress, by inspecting the boat or other experiment - to see for themselves. But it is useful for them to be able to see if a project is progressing as proposed. Though even that is best-guess work. However, it gives a theoretical target to aim for. That even the engineers themselves may enjoy looking at from time to time.


This of course means an extra layer of management [so more project cost], over and above the engineers and scientists engaged on the shop floor. Who apparently, don't know what they are doing, without a chart on the wall or desk to refer to.


One way of producing a Gantt chart, is using Microsoft Excel. There are literally dozens of specialist producers of software, at various degrees of expense. But, most people have Excel in their business library, under Office 365 licences or similar. Whatever software you choose, you will have to spend about a day working out all the glitches. Apart from actually inputting your Headings and Tasks. [How much will your application cost]


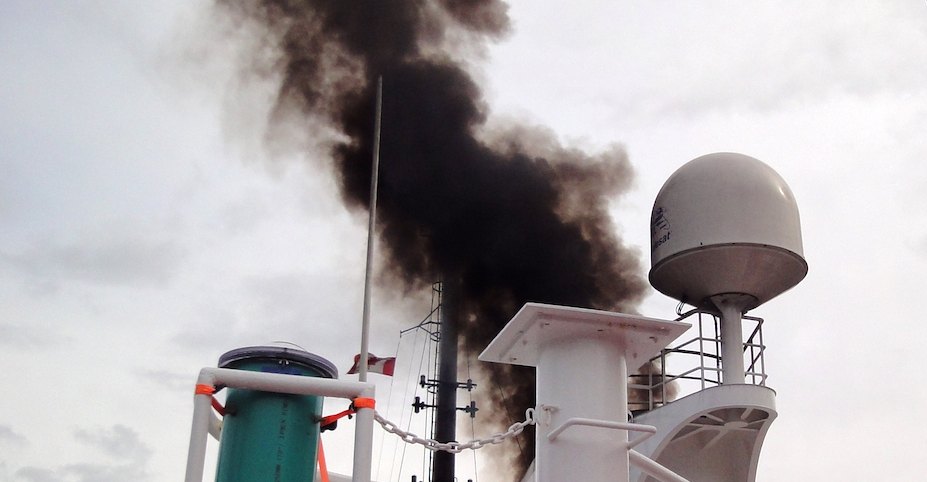
The Cleaner Ocean Foundation works to help protect the "seven seas" from the effects of anthropogenic atmospheric pollution like this ship that is belching diesel fumes like there is no tomorrow. We'd like to preserve tomorrow for our children. You can help us to make this scene a thing of the past.


INSPIRATION


Henry created the Gantt chart in the 1910s.

Gantt charts were employed on major infrastructure projects including the Hoover Dam and Interstate highway system and continue to be an important tool in project management and program management.

Henry Gantt's legacy to project management is the following:

- The Gantt chart: Still accepted as an important management tool today, it provides a graphic schedule for the planning and controlling of work, and recording progress towards stages of a project. The chart has a modern variation, Program Evaluation and Review Technique (PERT).

- Industrial Efficiency: Industrial efficiency can only be produced by the application of scientific analysis to all aspects of the work in progress. The industrial management role is to improve the system by eliminating chance and accidents.

- The Task And Bonus System: He linked the bonus paid to managers to how well they taught their employees to improve performance.

- The social responsibility of business: He believed that businesses have obligations to the welfare of the society in which they operate.


GANTT CHARTS


Gantt created many different types of charts. He designed his charts so that foremen or other supervisors could quickly know whether production was on schedule, ahead of schedule, or behind schedule. Modern project management software includes this critical function.

Gantt (1903) describes two types of balances:

- the "man’s record", which shows what each worker should do and did do, and
- the "daily balance of work", which shows the amount of work to be done and the amount that is done.

Gantt gives an example with orders that will require many days to complete. The daily balance has rows for each day and columns for each part or each operation. At the top of each column is the amount needed. The amount entered in the appropriate cell is the number of parts done each day and the cumulative total for that part. Heavy horizontal lines indicate the starting date and the date that the order should be done. According to Gantt, the graphical daily balance is "a method of scheduling and recording work". In this 1903 article, Gantt also describes the use of:

- "production cards" for assigning work to each operator and recording how much was done each day.


WORK, WAGES AND PROFITS - 1916

In his 1916 book "Work, Wages, and Profits" Gantt explicitly discusses scheduling, especially in the job shop environment. He proposes giving to the foreman each day an "order of work" that is an ordered list of jobs to be done that day. Moreover, he discusses the need to coordinate activities to avoid "interferences". However, he also warns that the most elegant schedules created by planning offices are useless if they are ignored, a situation that he observed. And of course all the man hours going into such creation is then wasted, increasing the carbon footprint of a project.


...


WHY ARE WE DOING THIS?


Because we can, and because we can, we must give it a chance.


Please use our A-Z INDEX to navigate this site


  GANTT CHARTS OFFER A QUICK REVIEW OF HOW WELL OF BADLY A PROJECT IS FARING

This website is Copyright © 2023 Jameson Hunter Ltd